
Sustainability is in the Best Interests of Business
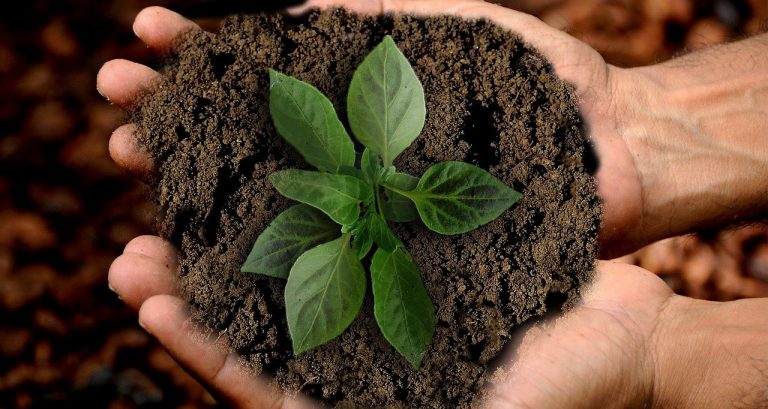
We are in the midst of the intensifying triple planetary crisis of climate change, biodiversity and nature loss, and pollution and waste. A triple crisis that threatens human health, prosperity, equality and peace – as we have seen only too…
Ministry for Innovation and Technology of Hungary and Energy Community Secretariat team up to Support Green Transition in the Western Balkans

The Ministry for Innovation and Technology of Hungary through its development agency of the Western Balkans Green Center (WBGC) and the Vienna-based Energy Community Secretariat joined efforts to help the Western Balkans fight climate change and foster the region’s green…
Electric Boats Race Into Venice Boat Show
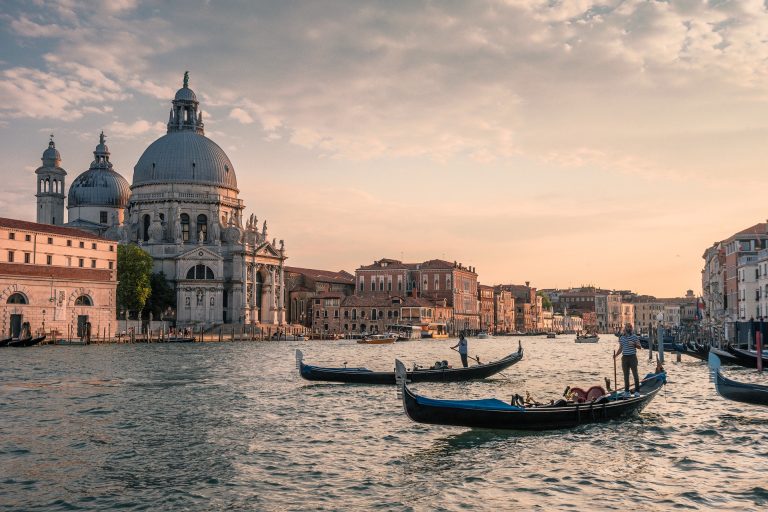
Electric transport is just as crucial on water as it is on land, especially for Venice, Italy, which is vulnerable to climate change. Electric power was a centerpiece of this year’s Salone Nautico. Source: ABB
The Right Measures Always Lead to a Solution
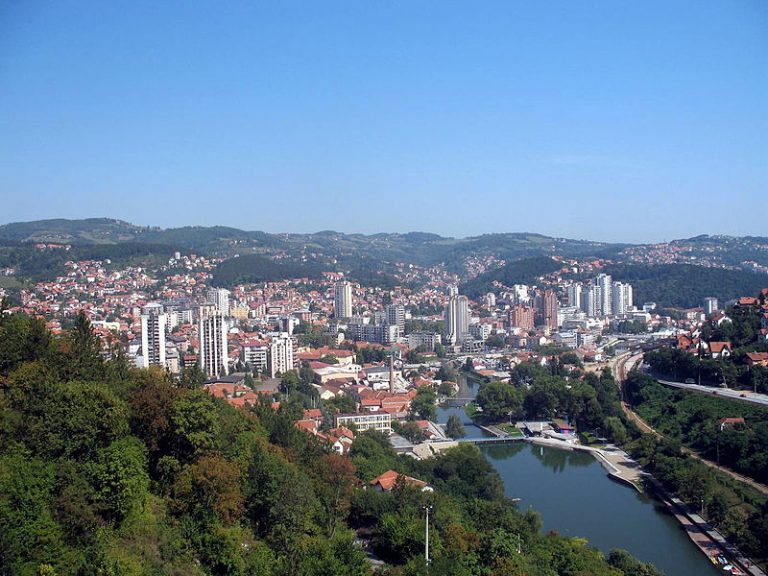
For many years, Užice was on the list of cities with the highest air pollution. During the heating season, it often happened that the amount of soot in the air exceeded the allowed limits several times. The city’s specific position,…
Native Hawaiian Community will have their Lands Restored
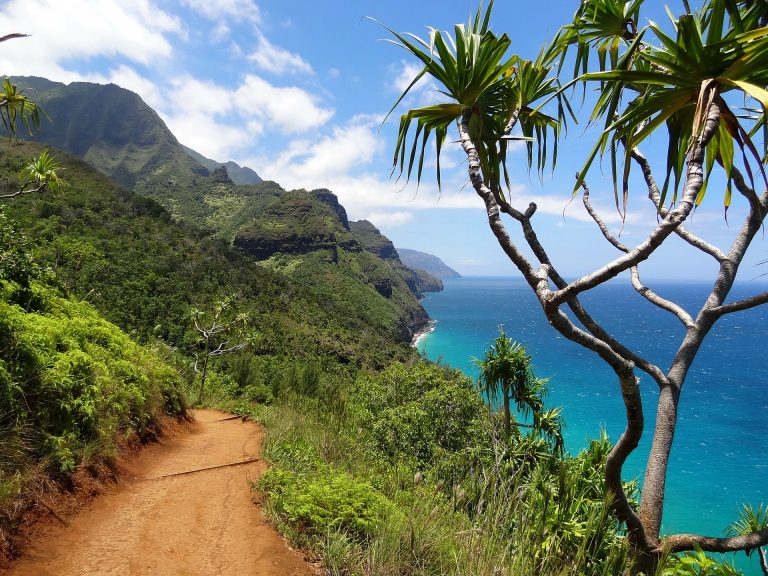
As part of the Biden-Harris administration’s commitment to honor relationships with Indigenous communities and uphold trust responsibilities, Secretary of the Interior Deb Haaland and Deputy Secretary of Commerce Don Graves today announced the transfer of an 80-acre parcel of surplus…
$200 Million More For Electric Vehicles, Batteries, & Connected Vehicles From US Department Of Energy
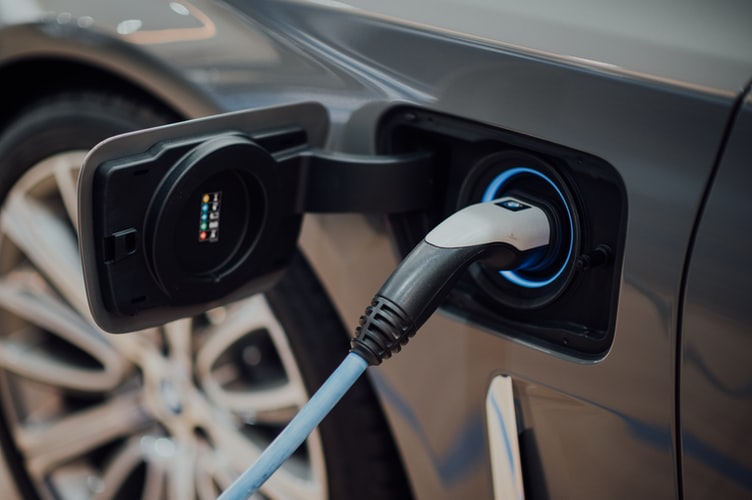
The U.S. Department of Energy (DOE) today announced $200 million in funding over the next five years for electric vehicles, batteries, and connected vehicles projects at DOE national labs and new DOE partnerships to support electric vehicles innovation. “We’re focusing…
Three Ways the US can Act on the Plastic Waste Crisis and Protect our Oceans
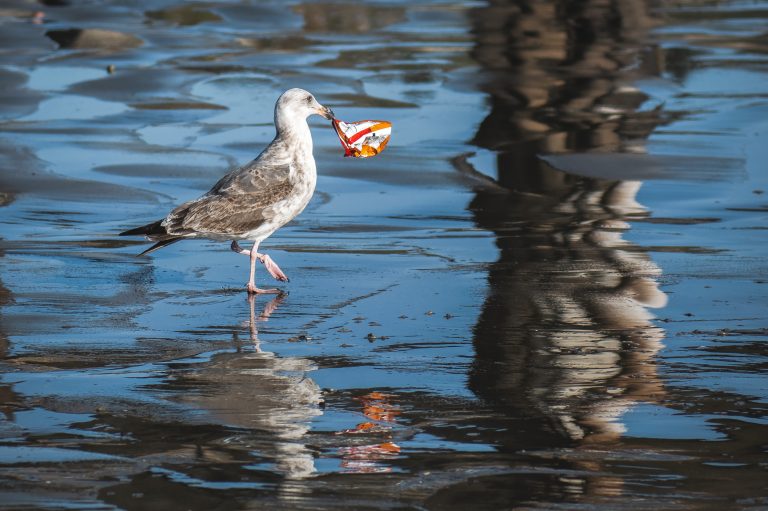
An exorbitant amount of plastic waste continues to plague our oceans, threatening marine life and the people who depend on these waters for their livelihoods. An estimated 11 million metric tons of plastic enters our oceans each year—the equivalent of…