


Newsletter Subscribe
Enter your email address below and subscribe to our newsletter
Enter your email address below and subscribe to our newsletter


Protecting ecosystems and biodiversity are key policy targets in the EU’s biodiversity strategy for 2030 and the European Green Deal. EU and national policymaking require approaches to be developed to measure the extent and condition of ecosystems to improve their management.
This briefing presents the EEA’s work on ecosystem extent accounts and pilot ecosystem condition accounts in the EU INCA project.
Examples illustrate the potential use of ecosystem accounting results to design measures to protect and restore European ecosystems, e.g. in implementing the EU biodiversity strategy for 2030.
Key messages
-The EEA has developed a set of ecosystem extent accounts that provide good spatial insight into the distribution and trends of up to 30 ecosystem types in Europe.
-Pilot accounts on ecosystem condition have been produced for species trends, freshwater quality and nutrient pressures.
-Successful ecosystem accounting builds on compiling different ecosystem reference data sets in one geo-spatial accounting system — the EEA Integrated Data Platform.
-The strength of input from ecosystem accounting to policy analysis is linked to the availability of geo-spatial ecosystem data based on regular monitoring.
The international ecosystem accounting framework
The methodological framework for ecosystem accounting builds on the System of Environmental-Economic Accounting (SEEA), coordinated by the United Nations Statistical Division (UNSD).[1] The UNSD handbook on experimental ecosystem accounting (SEEA EEA) describes the various components of ecosystem accounts (UN et al., 2014).
Ecosystem extent accounts:
-measure the location and size of different ecosystem types in a spatially explicit manner (e.g. in ha or km2);
-track the opening and closing stock of ecosystems across a territory over time.
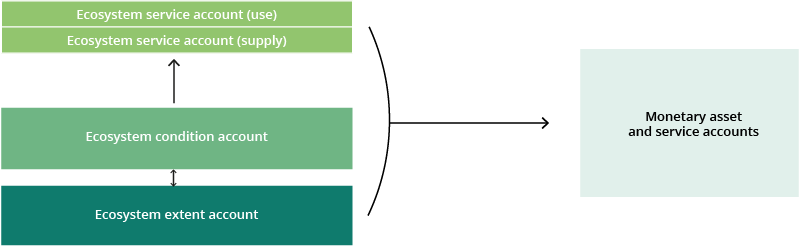
Ecosystem condition accounts measure the condition of ecosystem types. Together, ecosystem extent and ecosystem condition accounts:
-provide a detailed analysis of the area and the quality of ecosystems and their changes over time;
-describe the biological capacity of ecosystems to deliver ecosystem services, which are then measured by ecosystem service accounts in a third step.
Figure 1 sets out the basic overall structure of ecosystem accounts.
Building European ecosystem extent accounts
The production of ecosystem extent accounts requires three essential components:
-data sets that can be used to measure the extent and distribution of ecosystems — in Europe such data build on Corine Land Cover (CLC), which is part of the EU Copernicus programme;[2]
-software and methodology for processing these data sets within a structured accounting system — the EEA has developed specific accounting tools for this purpose (see EEA, 2020a);
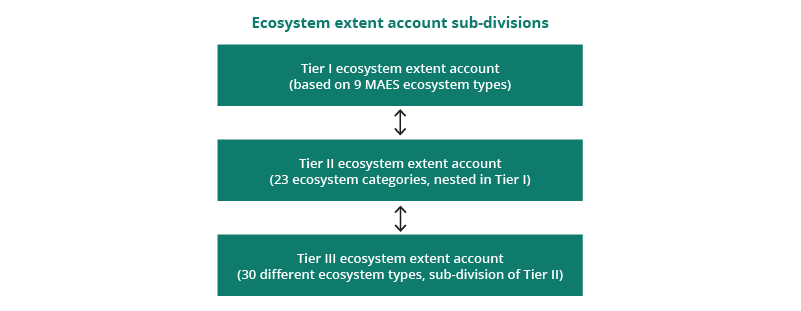
-a typology for ecosystems, to allow the identification of different ecosystem types — the EEA proposes a three-tier approach to developing ecosystem extent accounts in Europe.
Tier I comprises ecosystem extent accounts for 9 of the 12 broad ecosystem types developed in the Mapping and assessment of ecosystems and their services (MAES) process.[3] The tier II accounts sub-divide the broad tier I ecosystem types and comprise 23 ecosystem categories. The tier III accounts further subdivide tier II accounts and comprise 30 ecosystem types, e.g. salt marsh, broad-leaved forest and arable land. All current tiers in the EEA ecosystem extent accounts are based on the CLC database.
Figure 2 shows the general structure of the ecosystem extent accounts developed by the EEA (for additional details, please see EEA, 2020b).
SEEA EEA established the principle that ecosystem extent accounts should cover the entire terrestrial area of a country or territory and that the individual ecosystem classes should not overlap. The EEA’s approach complies with these principles and offers the potential to calculate ecosystem extent accounts for a variety of geographical areas within the EEA-39 territory[4]. This means that they can be used for analysing ecosystem trends at country level but also for more focused spatial analysis, e.g. at the level of river basins or of trends in protected areas (EEA, 2018b). This approach is based on the EEA’s land and ecosystem accounting system, embedded in the EEA Integrated Data Platform (EEA, 2020a).
Selected results for tier I European ecosystem extent accounts (EEA-39)
Table 1 shows the changes in ecosystem extent for the period 2000-2018 across the EEA-39 countries collectively. The accounts show changes in ecosystem extent in absolute terms (km2) and as a percentage of the initial ecosystem stock (see ‘Net changes to ecosystem extent’). This variable indicates that the area of urban settlements and associated vegetation expanded by 7.1 percent between 2000-2018. Rivers and lakes also increased in extent by 1.5 percent (mainly due to an increase in water reservoirs). Both trends reflect an increasing share of very modified ecosystem types in the EEA-39 area. Cropland and grassland lost most area in absolute terms, whereas heathland and shrub suffered the largest relative decline among the semi-natural ecosystem types.
The variable on stable ecosystem stock represents the areas that are the same ecosystem type in 2000 and 2018. In all cases, the percentage of ecosystem types remaining unchanged between 2000 and 2018 is very high (> 98 percent, except for forest). This is relevant knowledge as ecosystems maintain more ecological integrity if they remain stable over time than if they are recreated (as in a forest being replanted elsewhere).
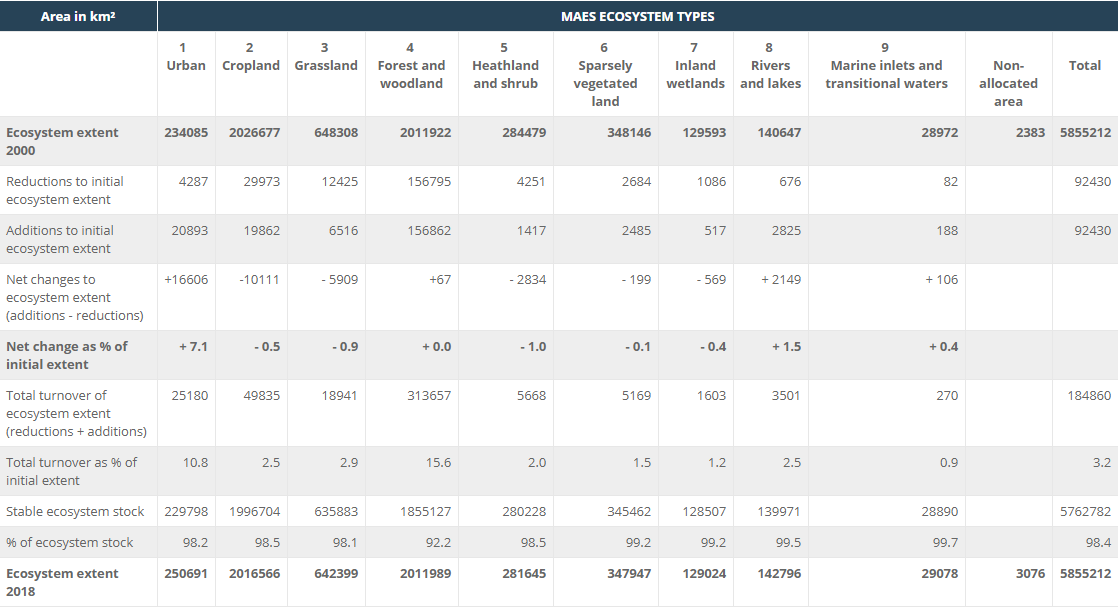
Note: The non-allocated area includes the CLC classes 334 (Burnt areas) and 523 (Sea and ocean) which could not be assigned to one of the nine MAES ecosystem types.
Figure 3 illustrates the spatial focus enabled by the EEA’s accounting infrastructure and summarises the information on relative changes in ecosystem extent inside and outside the EU-27[5]Natura 2000 network. This indicates that reductions in the extent of most ecosystem types — cropland, grassland, heathland and shrub, and inland wetlands — are lower within the Natura 2000 areas. Generally, protected sites in the Natura 2000 network show lower rates of ecosystem change than the area outside the network, which indicates a higher degree of ecosystem stability inside the EU protected area network. The exceptions are the rate of urban expansion (which probably indicates a pressure on more natural ecosystem types) and the increase in marine inlets and transitional waters (which may be the result of restoration measures).
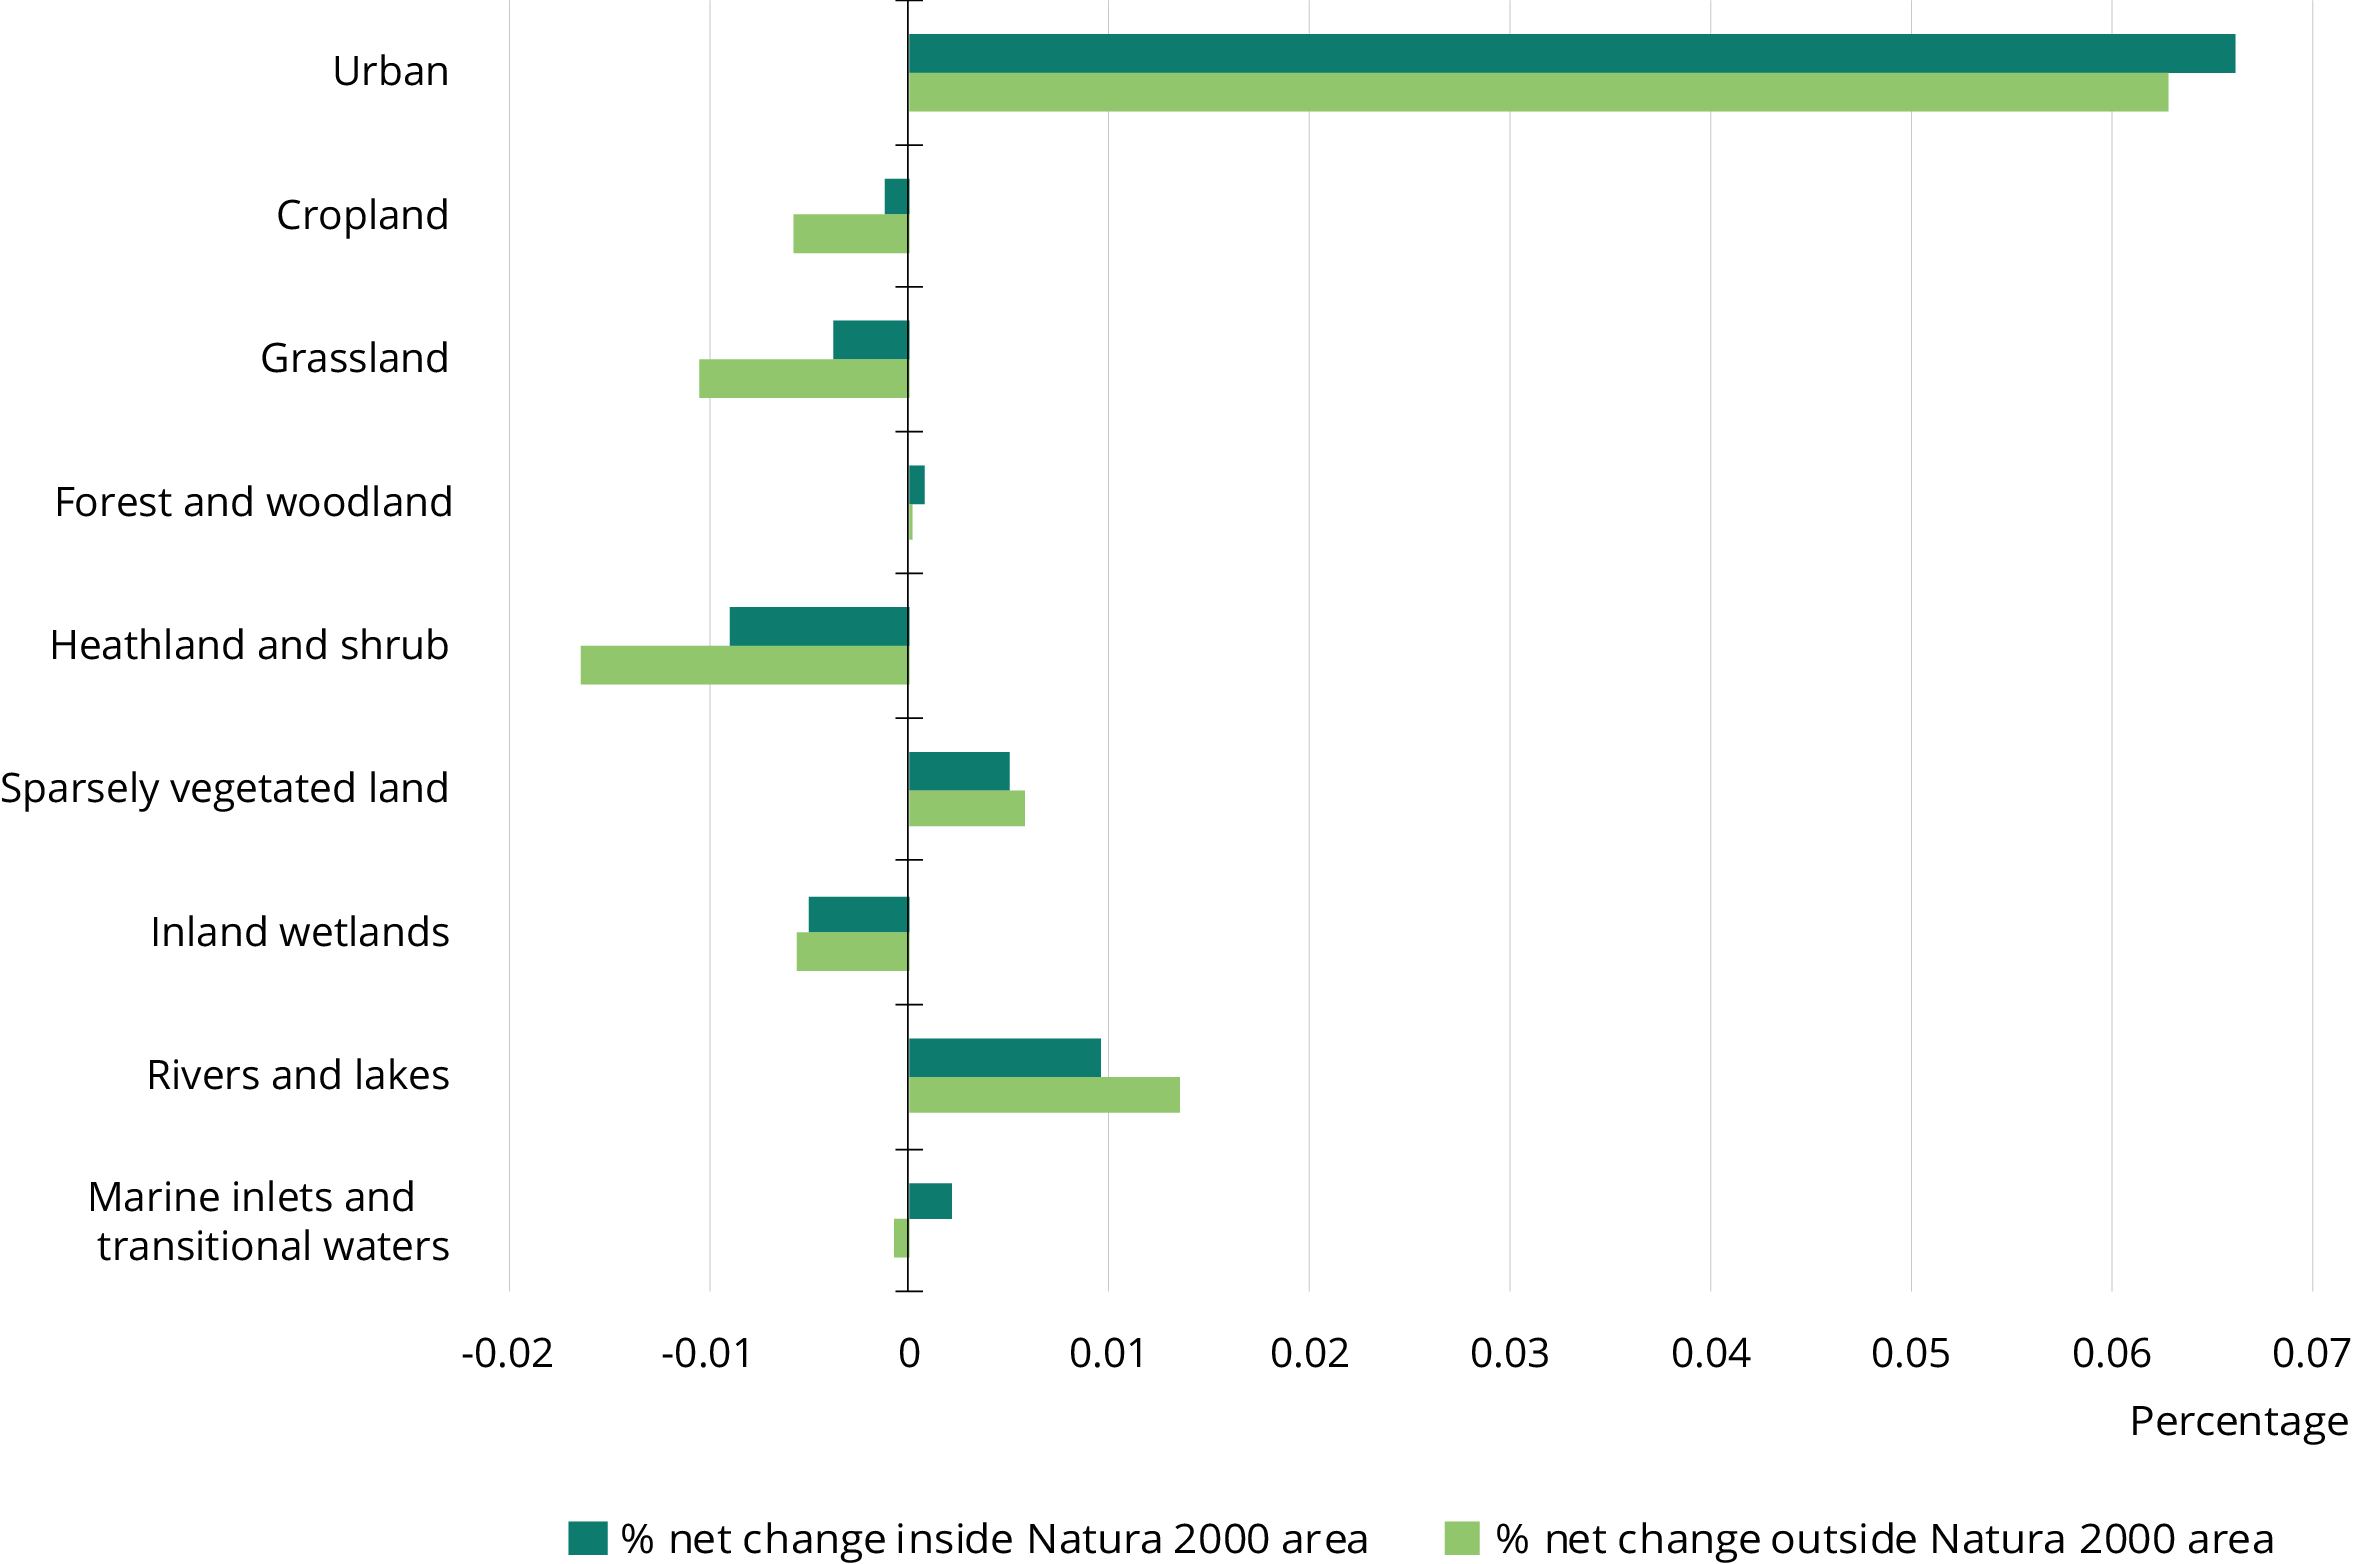
Note: The trend figures presented above exclude data for the United Kingdom.
Source: Follow this link for more information
Tiers II and III of EEA ecosystem accounts are calculated following the same principles but provide more detail than can be integrated into this short briefing. For information on ecosystem trends at tiers II and III level, please consult the EEA’s analytical report (EEA, 2020b) or the ecosystem extent account dashboard[6] for detailed results.
Pilot ecosystem condition accounts
Ecosystem condition reflects the overall quality of an ecosystem asset in terms of its characteristics. Measuring the ‘overall quality’ of ecosystem condition is a complex challenge, which has been analysed in the EU MAES process (EC, 2016, 2020). Ecosystem condition can be assessed in two ways:
-indirectly, by analysing pressures acting on ecosystems;
-directly, by tracking habitat condition, biodiversity and environmental quality.

The following EEA pilot ecosystem condition accounts are examples of these two approaches — the rivers and lakes ecosystem condition account is based on direct measurement, while the spatial nutrient account analyses nutrient pressures.
Rivers and lakes ecosystem condition account
The EU Water Framework Directive (WFD) (EU, 2000) establishes a 6-year river basin management plan (RBMP) reporting cycle for Member States on the ecological status of freshwater (lakes and rivers), transitional and coastal water bodies. The EEA has reported on the status of European waters (EEA, 2018a) and now uses this rich data set to develop ecosystem condition accounts for rivers and lakes in the EU.
Ecological status is an expression of the quality of the structure and functioning of aquatic ecosystems associated with surface waters (EU, 2000). The ecological status for each water body is reported as a composite indicator based on biological, hydro-morphological and physio-chemical quality elements. Hence, the ecological status can be regarded as a good indicator of ecosystem condition in water bodies. Ecological status is classified on a 5-point scale from high (1) to bad (5), with the lowest scoring quality element defining the overall ecological status of a water body. An accounting time series has been available since 2019, based on two rounds of reporting under the WFD:
-first river basin management plans (status in 2010);
-second river basin management plans (status in 2016).
Table 2 shows a pilot ecosystem condition account based on the WFD RBMP data for river and lake water bodies. Just as for ecosystem extent accounts, this tracks opening and closing stock, and the change in ecological status of water bodies between two reporting cycles of the WFD RBMPs. The stock measures reflect the number and extent (lake area or river length) of water bodies in each of the five WFD status classes i.e. high, good, moderate, poor and bad, as well as ‘unknown’. The approach developed allows tracking of intermediate changes among those water bodies having less than good ecological status (i.e. from poor to moderate or vice versa). This facilitates the calculation of a range of indices, of which two are shown here:

-overall trend index — allowing the calculation of overall status trends for the water bodies with data on ecological status available for both reporting periods;
-coverage index — describes the share of water bodies for which a trend was calculated (as water bodies with ‘unknown’ status in 2000 or 2016 were excluded from the analysis).
The coverage index shows that a trend calculation can only be performed on about 50-75 percent of the water bodies in each category. The overall trend index shows that, between 2010 and 2016, the reported average ecological quality status declined substantially for lakes (16.7 percent by lake area and 6.1 percent by number of lakes reported on) and declined much less so for rivers (ca 1.1 percent by river length or 3.7 percent by number of river counts). It should be noted that some Member States updated their assessment methodology between the two reporting periods, which may affect the size of trend for lakes in particular. These EU-level results can be further broken down by country, river basin and other geographical areas. These results are available in the EEA’s summary report on pilot ecosystem condition account for rivers and lakes (EEA, 2020c).
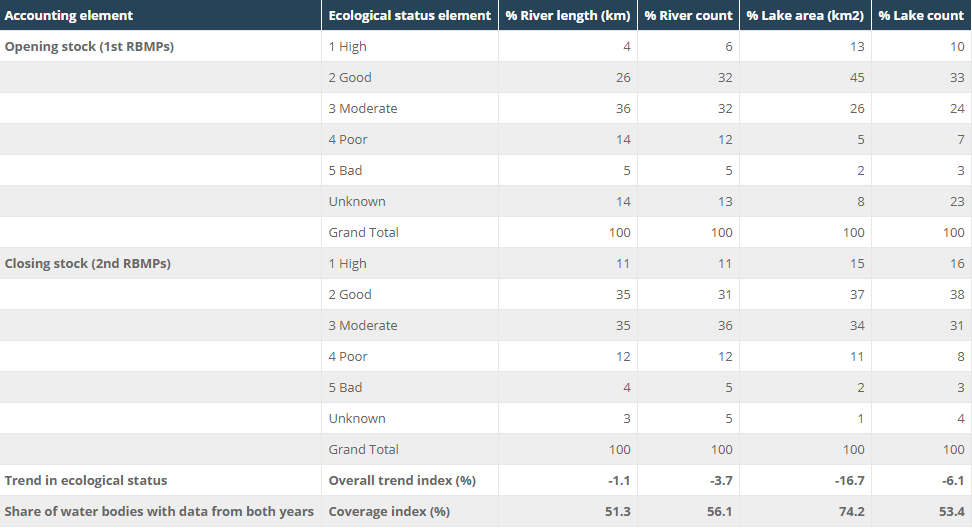
Note: RBMPs = river basin management plans;
EU-28 refers to (the 28 Member States comprising) the EU up until the departure of the UK. However, this table does not include data for Greece and Lithuania, because data was unavailable.
Pilot nutrient pressure accounts
Nutrient enrichment is a key pressure indicator for ecosystem condition, as all terrestrial and aquatic ecosystems are negatively affected by it (EC, 2016). Nutrients derive from a variety of sources, including agriculture, waste water discharges and atmospheric deposition.
The EEA has cooperated with the EU Joint Research Centre to develop spatially explicit nutrient pressure accounts for the EU using various input data and modelling. These include:
-gridded farm statistics provided by Eurostat;
-atmospheric nitrogen deposition data from air monitoring programmes;
-data on agricultural nutrient use generated by the common agricultural policy regionalised impact (CAPRI) agro-economic model.
The model-derived data on nutrient pressures (at the soil surface) are spatially allocated to different MAES ecosystem types by using the same CLC data underpinning the ecosystem extent accounts. This allows ecosystem condition accounting tables to be produced that can show:
-the average nutrient pressures on different ecosystem types over time, at EU, country or regional level;
-a breakdown of nutrient pressure by varying input levels and their spatial distribution.
By developing a spatially explicit accounting approach, it is possible to identify areas where nutrient inputs exceed certain load levels. This adds a new analytical functionality, compared with standard nutrient balances that provide average values per country or at the large region level. Table 3 presents information on the trend in the shares of four different nitrogen input levels for grassland ecosystems between 2000 and 2010.
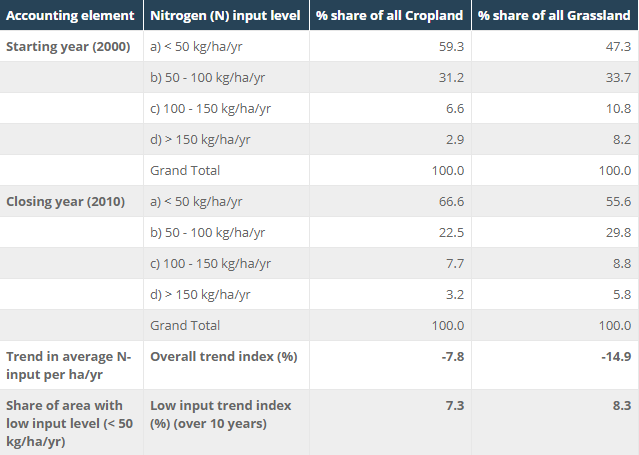
Note: The trend figures presented above exclude data for Croatia, as it was not available.
The available data suggest that the area share of the N input category of below 50 kg N/ha has increased over the period monitored, whereas the area shares of all higher N input levels have decreased. Analysis based on the average N input level per hectare for the entire area covered would not have identified these sub-trends. However, the approach presented above includes only a coarse spatial representation and lacks sensitivity with regard to the response of different grassland ecosystem sub-types to N input. For example, highly productive grasslands are adapted to N input levels of 100kg N/ha or more but are often species poor. The botanical species diversity of semi-natural grasslands can only be maintained if yearly N input levels stay below 30 kg N/ha.
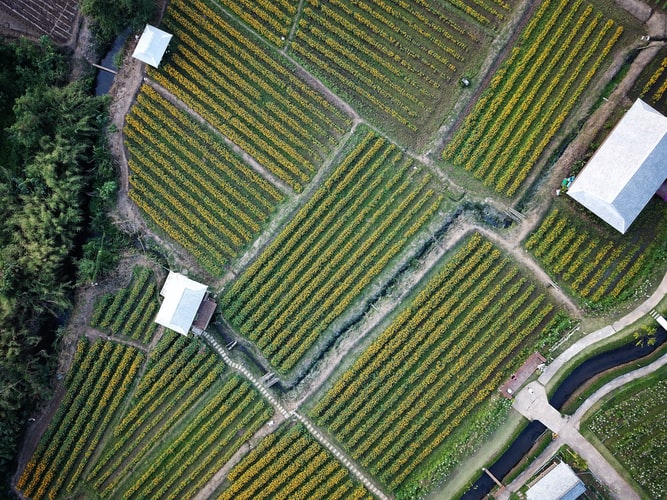
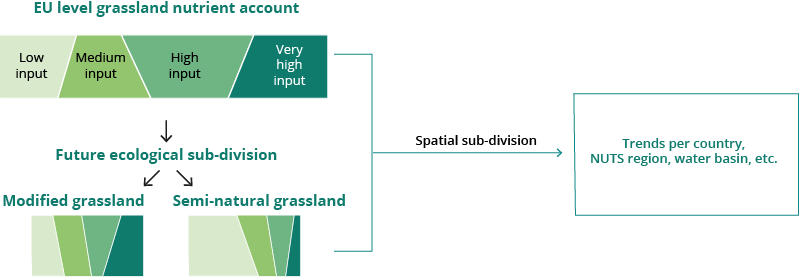
Figure 4 illustrates how the spatial nutrient accounts could be further developed to identify ecosystem sub-types and areas that require policy action to reduce nutrient pressures. Work is under way to develop further spatial detail and extend the current times series to 2018. This will allow the presentation of spatial nutrient accounts that have more analytical power and provide concrete policy input, e.g. on the nutrient pressures inside Natura 2000 areas compared with those of general farmland. Additional information and results from the pilot nutrient accounts are available in the EEA’s summary report on pilot EU nutrient accounts (EEA, 2020d).
Overview and conclusions
We have made good progress in developing European ecosystem extent accounts. They offer a substantial level of ecological detail and can be used to look at trends in Natura 2000 areas, river basins, etc. However, it would be useful to further differentiate agriculture and forest ecosystem types, e.g. by building on forthcoming Copernicus phenology data.
The pilot ecosystem condition accounts show how the accounting methodology can be used to show spatial trends for key ecosystem condition parameters. The EU-level ecosystem condition assessments per MAES ecosystem type provide an important comprehensive review of ecosystem condition (EC, 2020). Future work at EU level could combine such ecosystem assessment work with ecosystem accounting tools in a shared platform for tracking the condition of European ecosystems over the coming years.
The spatial foundation for the pilot nutrient accounts enables the identification of pressure hot spots, where ecosystem thresholds have been exceeded. This adds spatial detail to the analysis of the condition of agro-ecosystems, which could be used to address nutrient reduction targets in the EU biodiversity strategy for 2030, for example.
The EEA Integrated Data Platform enables many different ecosystem reference data sets to be compiled in one geo-spatial accounting system. This supports the development of more complex ecosystem accounts and detailed geo-spatial analysis. Further analytical progress in describing the pressures on, and trends in, European ecosystems will also require a further investment in geo-spatial ecosystem data sets based on regular monitoring programmes.
Source: EEA