


Newsletter Subscribe
Enter your email address below and subscribe to our newsletter
Enter your email address below and subscribe to our newsletter

Flash floods cause more than 5,000 deaths worldwide annually, exceeding any other flood-related event. They have enough power to change the course of rivers, bury houses in mud, and sweep away or destroy whatever is on their path. They are…
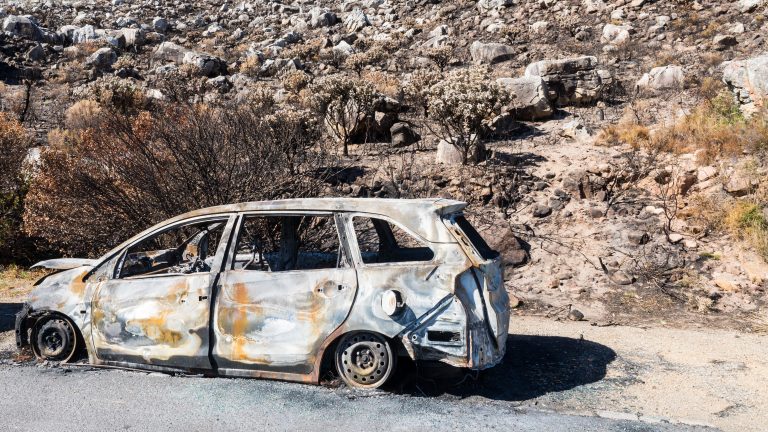
When you see a new car, you might think of the speed it can attain, the sound system on offer, the upholstery, or its range, if electric. But have you ever stopped to think about the greenhouse gas emissions created…

In accordance with the current decisions of the Government of the Republic of Serbia, and in the belief that by the beginning of July the situation in the field of health in the world will be completely stabilized, the Organizing…

Although it is imposed on him, due to his job and career, to watch seas and oceans from a different perspective than most people and, therefore, he notices what is hidden on the dark bottom, the famous Croatian diver, Goran…

The EBRD has unveiled an emergency €1 billion “Solidarity Package” of measures to help companies across its regions deal with the impact of the coronavirus pandemic. This is an initial response to the crisis and the Bank stands ready to…
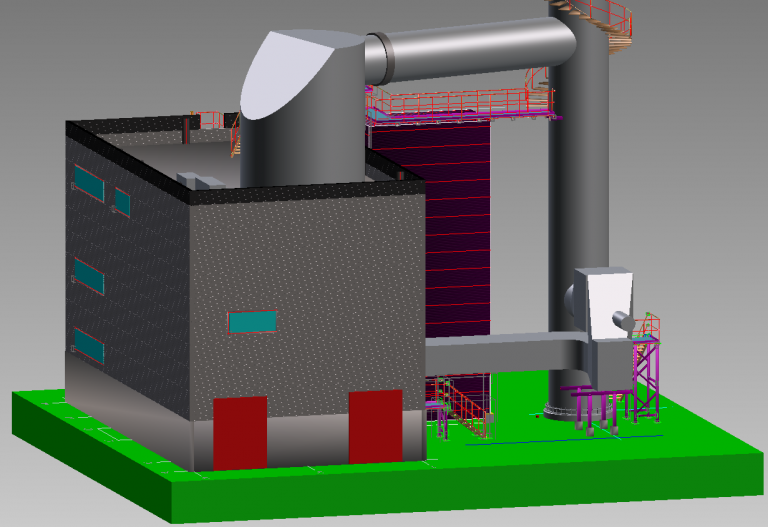
KPA Unicon and Keravan Lämpövoima Oy, a subsidiary of Keravan Energia and an operator of a bio-power plant, have signed a contract for Unicon Condenser, which will significantly improve energy efficiency of the existing 80 MW bio-power plant and reduce…

Emission cuts in the European Union’s (EU) Effort Sharing sectors need to accelerate considerably from 2018 onwards to achieve the current EU 2030 targets, according to a European Environment Agency (EEA) briefing, published recently. In particular, the large amount of…